Posts

The Chinese History of Pascal's Triangle

Image
The fascinating Pascal Triangle follows a triangular array of numbers that presents us with the coefficients in order to expand, and even solve for any binomial expression raised to any power. While Blaise Pascal was one of the first to discover  many of the interesting properties and present the idea on a wider scale, he was not the first to discover the actual triangle. The first people to discover the triangle were the Chinese. As early as the 10th century, Chinese mathematician, Jia Xian, formed a basis on a triangular diagram that still grasps the same concepts and ideas as we see it today! This was Jia Xian's presentation of his triangle created. The dashes and lines shown above are "rods" that were actually used in early Chinese mathematics.  The Chinese Rod system was actually used for doing arithmetic rather than writing and recording. As you can see from Jia Xian's triangle above, the system stays more or less the same.  The first column has the Chin

Americans and Mathematics

Image
Every couple of years, I always look at PISA's* rankings of math around the world. When I first saw the rankings a few years ago, I was so surprised that America's ranking was around 26th. I wondered how this was even possible with globally leading universities such as Harvard, MIT, and Stanford being here in the US. What didn't surprise me was Asian nations topped the charts for each subject. I had heard of cram schools, as well as the very stressful life of being a student in countries such as Korea, Japan, or Singapore. Also the higher rankings of countries such as Finland weren't surprising to me either since their methods of working very hard in school instead of bringing home thick stacks of homework seemed to work among the student population. Flash forward to 2015, the most recent pool of data from PISA, and the United States had dropped from 27th in 2012 to 41st in 2015. The question has to be asked, "Why does the US rank so poorly when it comes to mathema

Quadrature of a Parabola

Image
Hippocrates, the great Greek physician lived over 2300 years ago. He laid the foundation for constructing the quadrature of a lune. Another great mathematician and thinker, Archimedes came up with many new mathematical ideas that ahead of its time and so new to the public.  For a lune to be produced, a parabola must be drawn.  The Ancient Greeks viewed Parabolas, circles, ellipses, and hyperbolas as conics. Archemedes had the brilliant idea of trying to figure out how to calculate the area of a curve.  Finding the area under a curve had been a ongoing problem that had yet to be solved. Fair trade partly relied on being able to work out volumes of cylinders and spheres. Archimedes worked out some approximations for the area of a circle and the value of π (pi). Through this idea of finding the area of a parabola,   you can take any segment of a parabola cut off by a line AB, and if P is the point on the segment furthest from AB, then the area of the parabolic segment ABP is four-thir

Computers and Animations

Image
When we think of animations, the first thing that probably pops into our minds are drawings that have simply come to life. Though this seems so simple, it process of animating a film per say or video game requires a complexity of skillfulness. Computer animation typically deals with objects that are modeled on a larger scale and in precise details, take Dash from the Incredible's series and something as simple as his hair as it blows past him when he's on the move. While he's in motion, his hair  there are probably around 100,000 individual elements all working their magic at once, so we see this little insignificant aspect of the film. While surfing the internet for information of animations and computers, I came across a TED talk about the details and elements that are implemented into Pixar Films, it's really fascinating!  Link: https://www.ted.com/talks/danielle_feinberg_the_magic_ingredient_that_brings_pixar_movies_to_life/transcript?language=en  http://graph

The 4th Dimension and our Minds

Image
We humans life in a three-dimensional world. Those three dimensions are commonly known as length, width, and height. An example of a three-dimensional shape is a cube. Whether an object is three-dimensional or two-dimensional, our minds can visualize what that object may be or look like. When we jump into shapes that are in the 4th dimension however, our minds get fuzzy and we scratch our heads in confusion. If we can think about how the volumes of shapes play a role in number of dimensions a shape has, then it's quite straightforward. The volume of a side of a cube has the expression, x 3   or "x  cubed". This means that for a hypercube it is simply  x 4 . https://vignette.wikia.nocookie.net/alldimensions/images/6/64/Tesseract_the_four-dimensional_hypercube_-GIF-_-_Imgur.gif/revision/latest?cb=20130219082716 The animation above shows what is commonly known as a four-dimensional cube: a hypercube, or tesseract. The  4D object is being rotated for

Trig: The Pitch of a Roof

Image
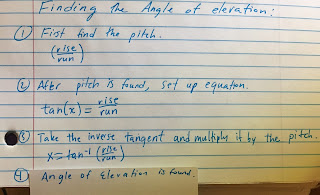
When developers are constructing houses, they must account for the roof. When constructing these roofs, the word pitch is used to assess the incline.  The term "pitch" is another type of measurement that is expressed when using slope. Like grade, it determines the steepness of a slope, but instead of measuring roads, pitch measures the steepness of roofs. Like grade and slope, to determining pitch is quite simple. You take the rise over run. When finding the angle of elevation of a roof when given its pitch, you simply take the inverse tangent and multiply it by the pitch. For example, a terracotta roof vertically "rises" 11 inches for every 18 inches horizontally "run". This means the pitch of the roof would be 11/18. What would the angle of elevation of the roof be? To solve this problem and find the angle of elevation, you simply take the inverse tangent and multiply it by the pitch. If following steps above, you should get the answer

Grade of a Road

Image
Today I'll be explaining grades of roads. Determining the correct grade of the road on a highway is extremely important to the safety of the motorists and drivers who drive on a certain road with a grade. The grade of a road is determined by the simple ratio of "rise over run." The grade  indicates how long you must travel up or down a road for a vertical rise or drop of a foot.  The rise is the change in vertical distance and the run is the change in horizontal distance. In short, the grade of roads are measured by the slope or incline of distance traveled. When you see grade signs on the sides of roads or highways, they're expressed in percentages. "x%" grades show the percentage of grade the road has. To find the percentage of the road, you simply multiply the decimal grade by "100".  Grade and slope are very closely related. In terms of finding the incline or slope of a road, they both measure the steepness. The slope shows the direct